
Data Analytics Services in Jakarta — Dashboards, Pipelines & Predictive Models
RAPTEK turns raw data into clear, measurable decisions for businesses in Jakarta and across Indonesia — dashboards, data pipelines, warehousing, and predictive models.
Book a free consultation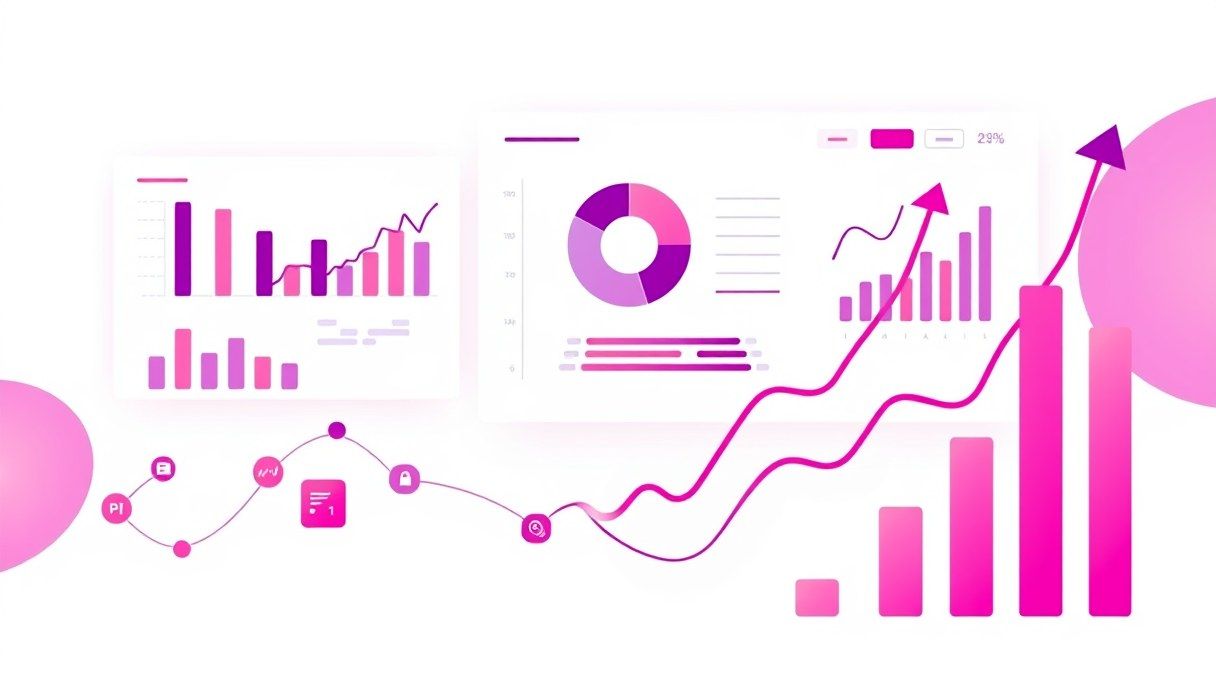
Most businesses are not short on data. They are short on answers. Sales numbers sit in one tool, marketing spend in another, operations in a spreadsheet someone updates by hand — and when a real question comes up, the report takes a week to assemble and is half out of date by the time it lands.
Data analytics closes that gap. We turn the raw data you already collect into something you can act on: clear dashboards, reliable pipelines, and models that tell you what is likely to happen next. That is what RAPTEK does — we make data legible, trustworthy, and useful, so the next decision is based on evidence instead of a hunch.
What we build
- Dashboards & reporting. Live, role-specific views that answer the questions your team actually asks — revenue, churn, pipeline, stock, campaign performance — refreshed automatically instead of rebuilt by hand every Monday.
- Data pipelines & warehousing. The plumbing that pulls data from your apps, databases, and third-party tools into one clean, queryable place, so every number has a single source of truth instead of five conflicting ones.
- Predictive & ML models. Forecasting, scoring, segmentation, and anomaly detection — models that move you from describing what happened to anticipating what comes next.
- Data quality & governance. Validation, documentation, and access rules so the numbers are correct, consistent, and safe to share across the business.
Problems we solve
Most teams reach us with one of a few familiar frustrations: reports that take days to compile, dashboards nobody trusts because the figures never quite match, data scattered across tools that refuse to talk to each other, or a gut feeling that the data holds an answer they simply cannot get to. The common thread is that the data has become noise instead of signal — and the right setup turns it back into a decision-making asset.
How we work
We deliver in short, visible iterations rather than disappearing for months and returning with a dashboard nobody asked for. You see working views and real numbers early, which means we can confirm we are measuring the right things while it is still cheap to adjust. The goal is never a prettier chart for its own sake — it is a metric someone will actually use to make a call.
A typical engagement moves through five stages:
- Discovery — understand the decisions you need to make and the questions behind them.
- Data audit — map your sources, judge their quality, and find the gaps.
- Build — develop the pipelines, warehouse, and dashboards in reviewable steps.
- Validate — check the numbers against reality so the output earns your trust.
- Support — maintain, monitor, and extend the system as your questions evolve.
Our technical approach
We choose tools to fit the problem, not the other way around. A focused dashboard on top of a clean warehouse beats a sprawling platform nobody maintains, so architecture stays as simple as the requirements allow and no simpler. Pipelines are tested and documented; metric definitions are written down and agreed, so “active customer” or “monthly revenue” means the same thing in every report.
Predictive models follow the same discipline. We start from a real question and a clear measure of success, prove value on something small, and only add complexity when it earns its place — a model you can explain and trust beats a black box that quietly drifts. Analytics is also what makes marketing measurable: clean attribution and honest dashboards turn spend into something you can judge, which is why this work pairs naturally with our digital marketing services. And when a dashboard needs to live inside a product or internal tool, it connects directly to our software development work.
What you get
Every engagement ships more than a chart. You get dashboards your team will actually open, pipelines documented well enough for a future team to extend, agreed definitions for the metrics that matter, and a direct line to the people who built it all. We treat data as a living system — sources change, questions change — so what we build is made to keep evolving rather than to be rebuilt from scratch next year.
Why RAPTEK
We are a Jakarta-based technology company, PT Raptor Auto Teknologi, with senior engineers and over fifteen years of combined experience building real systems for real businesses across Indonesia. We are small enough that you work directly with the people modelling your data, and experienced enough to tell the difference between a number that looks impressive and a number you can act on. We build analytics we would be willing to rely on ourselves — because often, we do.
Start the conversation
If your reports take too long, your dashboards disagree with each other, or you suspect the answer is sitting in data you cannot quite reach, we would like to hear about it. The first conversation is a free consultation — no obligation, just a clear, honest view of what your data could be telling you.
Frequently asked questions
- Do we need a data warehouse before you can help us?
- No. We often start with the tools and data you already have, then introduce a warehouse only when the volume or number of sources makes one genuinely worth it. The right setup matches your scale, not a checklist.
- Can you work with our existing spreadsheets and tools?
- Yes. Most engagements begin exactly there — spreadsheets, your CRM, accounting software, ad platforms. We connect to what you use rather than asking you to rip everything out and start over.
- What is the difference between a dashboard and a report?
- A report is a snapshot you build for a specific moment, while a dashboard is a live view that refreshes itself so the numbers are always current. We build both, but a dashboard usually replaces the weekly scramble of rebuilding the same report by hand.
- We do not have much data, or it is messy. Is that a problem?
- Not at all. Cleaning and organising imperfect data is a normal first step, and useful analytics often come from a surprisingly small amount of it. We are honest early about what your data can and cannot answer yet.
- Do we need machine learning, or just clear reporting?
- Most businesses get the biggest gains from clear, trustworthy reporting first. We only recommend predictive or machine learning models when there is a real question they answer and a clear measure of success, never for their own sake.