
What Is a Business Intelligence Dashboard — and Why Your Company Needs One
What a business intelligence dashboard is, how it differs from a static report, what makes one actually useful, and how to start turning your data into decisions.
- Data Analytics
- Business Intelligence
- Dashboards

Most companies are not short on data — they are short on answers. Sales numbers sit in one system, finance in another, operations in a spreadsheet someone updates by hand, and marketing in a tool only one person knows how to log into. The data exists, but turning it into a clear picture of how the business is doing takes hours of copy-paste, and by the time the picture is ready, it is already out of date.
A business intelligence dashboard is the answer to that problem. It pulls your scattered data into one place and turns it into a live, visual view of the numbers that matter — so that anyone who needs to make a decision can see where things stand at a glance. This guide explains what a BI dashboard really is, how it differs from the reports you already produce, what makes one genuinely useful instead of ignored, and how to start building yours without boiling the ocean.
What a BI dashboard actually is
A BI dashboard is a single screen that shows your key business metrics — your KPIs — as charts, numbers, and tables that update on their own as new data arrives. Think of it the way you think of a car’s dashboard: you do not stop to read a 40-page report to learn your speed and fuel level, you glance at the dials. A business intelligence dashboard does the same job for a company. Revenue this month, orders today, cash on hand, conversion rate, stock running low — all visible in seconds, all current.
The word that matters most is live. A good dashboard is connected to your data sources, so the moment a sale is recorded or an invoice is paid, the number moves. There is no rebuilding, no re-exporting, no “let me pull the latest figures.” The latest figures are already there.
The second word that matters is interactive. Instead of one fixed view, a dashboard lets you filter by date range, branch, product, or region, and drill from a high-level total down into the detail behind it. You see that this month’s revenue is down, click into it, and find that one region is the cause — in the same screen, in a few clicks.
A dashboard is not a static report
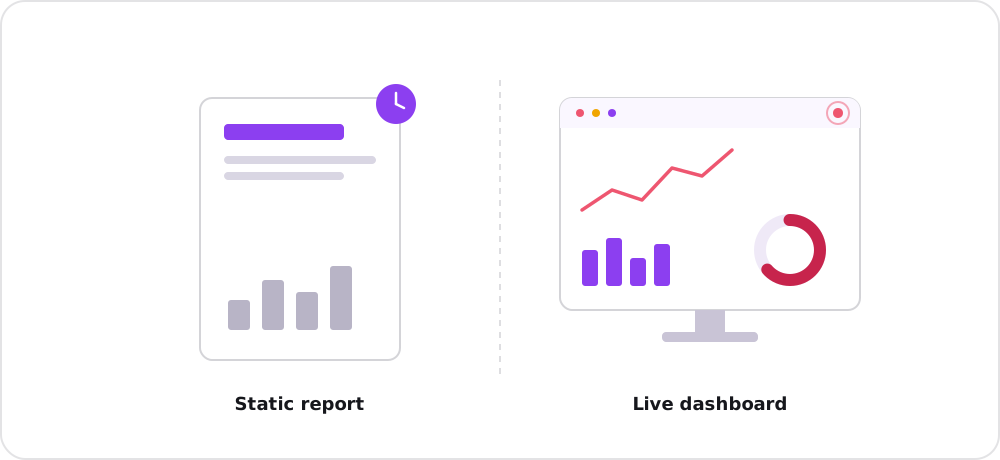
A static report is a snapshot in time; a dashboard is a living view that updates itself.
Many people first meet “business intelligence” as a stack of monthly reports, so it is worth being clear about the difference, because it is the whole point.
A static report is a snapshot. Someone gathers data, formats it, and sends it out — a PDF, a slide deck, a spreadsheet. It is accurate for the moment it was made and frozen forever after. To ask a question it does not already answer, you have to go back to whoever built it and wait for the next version.
A dashboard is alive. It is built once and then keeps itself current. You do not wait for it; you open it. And because it is interactive, it answers the follow-up questions a static report cannot — the ones that only occur to you once you have seen the first number.
| Aspect | Static report | BI dashboard |
|---|---|---|
| Freshness | A snapshot, frozen in time | Live, updates on its own |
| Questions | Only what was built in | Filter and drill to ask your own |
| Effort | Rebuilt manually each cycle | Built once, then self-serving |
| Availability | Sent when someone makes it | Open it whenever you need it |
The practical effect is a shift from producing numbers to using them. The hours your team spends each month assembling reports get handed back, and the answers that used to take days arrive in seconds.
What data feeds a dashboard
A dashboard is only as good as the data behind it, and that data usually lives in many places. A typical company’s numbers are spread across the systems it already runs:
- Sales and CRM — deals, pipeline, customers, win rates.
- Finance and accounting — revenue, expenses, cash flow, receivables.
- Operations and inventory — orders, stock levels, fulfilment, production.
- Marketing — website traffic, ad spend, leads, campaign performance.
- Spreadsheets and manual logs — the targets, budgets, and one-off data that never made it into a system.
The job of a BI setup is to bring these sources together so they can be seen as one story rather than a dozen disconnected ones. That joining-up is where the real value appears: revenue from finance next to leads from marketing next to stock from operations, finally in the same frame.
What makes a dashboard used instead of ignored
Plenty of dashboards get built and then quietly abandoned. The difference between one your team opens every morning and one nobody looks at comes down to a few things.
The right metrics
A dashboard crowded with every number you can show is worse than one with the few you should. The discipline is to start from the decision, not the data: what will someone actually do differently based on this screen? Show the metrics that drive those decisions, and leave the rest out. A handful of clear KPIs beats fifty noisy ones.
Clear design
A dashboard is read in seconds, so it has to be legible at a glance. The most important numbers should be the most prominent. Charts should match what they show — trends as lines, comparisons as bars, parts of a whole sparingly. Clutter, decoration, and chart types chosen for looks rather than meaning all push people away. Good design here is not prettiness; it is clarity.
Trustworthy data
The first time a number is wrong, people stop trusting the whole dashboard — and a dashboard nobody trusts is worse than none, because it invites bad decisions made with false confidence. The numbers must reconcile with reality and with each other. That trust is earned underneath the surface, in the pipeline that cleans and joins the data before it is ever shown.
A decision it serves
Every dashboard should answer a clear question for a clear audience. A sales leader asks different questions than a CFO. The most-used dashboards are built for a specific person and a specific recurring decision — not as a generic “overview” that serves everyone a little and no one well.
Common dashboards by function
While every business is different, a few dashboards earn their keep almost everywhere:
- Sales — pipeline value, deals won and lost, revenue against target, performance by rep or region. Answers: are we going to hit our number, and where?
- Finance — revenue and expenses, cash flow, margins, receivables and payables. Answers: are we healthy, and where is the money going?
- Operations — orders, fulfilment times, inventory levels, capacity. Answers: are we delivering smoothly, and what is about to run short?
- Marketing — traffic, leads, cost per acquisition, campaign and channel performance. Answers: what is working, and where should the next rupiah go?
Most companies start with the one tied to their most painful recurring question and grow from there.
What you need to build one
Three pieces sit behind every working dashboard.
Data sources. The systems above — your CRM, accounting, operations tools, and spreadsheets — are the raw material. You almost certainly already have these.
A pipeline and a place to put the data. Real-world data is messy: different systems name the same customer differently, formats clash, and records duplicate. A data pipeline extracts data from each source, cleans and standardises it, and loads it into a central data warehouse — one trustworthy place where everything agrees. This unglamorous layer is what makes the dashboard above it reliable, and it is the part most home-grown attempts skip and later regret. It often draws on the same engineering discipline behind any custom system you build.
A BI tool. Finally, a business intelligence tool — Power BI, Looker Studio, Metabase, Tableau, and others — connects to the warehouse and turns the prepared data into the live, interactive screens people actually use. The tool is the visible part, but it is only as good as the pipeline feeding it.
How to start small
The most common mistake is trying to build everything at once — a grand, company-wide dashboard that takes months and pleases no one. The better path is the opposite.
Pick one decision that hurts today: the report someone rebuilds by hand every Monday, the number nobody can answer without a meeting. Build the smallest dashboard that answers it well, using the data sources that question needs and nothing more. Get it in front of the people who will use it, watch how they use it, and refine. Once it is trusted and relied on, add the next one. Momentum and trust compound; a single dashboard people open daily is worth more than ten nobody asked for.
Conclusion
A business intelligence dashboard turns data you already own into decisions you can make faster. Unlike a static report, it stays current, answers your own follow-up questions, and hands your team back the hours they spend assembling numbers by hand. What separates a dashboard people live in from one they ignore is not the tool — it is the right metrics, clear design, data they can trust, and a real decision it serves.
You do not need a data team or a six-month project to begin. You need one painful question, the data that answers it, and a clean pipeline underneath. Start there, earn trust, and grow.
If you would like help turning your scattered data into dashboards your team actually uses — from the pipeline underneath to the screens on top — that is exactly what our Data Analytics work is for. Reach out for a free consultation.