
What Is a Data Pipeline? How Raw Data Becomes Business Decisions
A plain-English guide to data pipelines — the five stages raw data moves through, the difference between ETL and ELT, batch vs streaming, and how to build one that stays trustworthy.
- Data Analytics
- Data Engineering
- ETL
- Data Pipeline

Every dashboard, forecast, and “how are sales doing this week?” answer rests on something most people never see: the plumbing that carries data from where it is created to where it can be used. That plumbing is a data pipeline — and when it works, it is invisible. When it breaks, every chart downstream quietly starts lying.
If your business runs on a website, a point-of-sale system, ad platforms, a spreadsheet or two, and an accounting tool, your data already lives in a dozen scattered places, in a dozen different shapes. A data analytics practice turns that scatter into decisions, and a data pipeline is the first thing it builds. This guide explains what a pipeline actually is, the stages data moves through, and the handful of choices — ETL vs ELT, batch vs streaming — that decide whether yours is fast, cheap, and trustworthy or slow, expensive, and wrong.
What a data pipeline actually is
A data pipeline is an automated series of steps that moves data from its sources to a destination where it can be analyzed, reshaping it along the way. The word “automated” is the point. You could export a CSV from each system every Monday and paste it into a master sheet by hand — and plenty of companies still do — but that is a fragile ritual that breaks the week someone is on holiday. A pipeline does the same work on a schedule (or continuously), the same way every time, without a human in the loop.
Almost every pipeline, however simple or elaborate, is built from the same five stages: data is pulled from sources, ingested, stored, transformed into a clean and useful shape, and finally served to the people and systems that consume it.
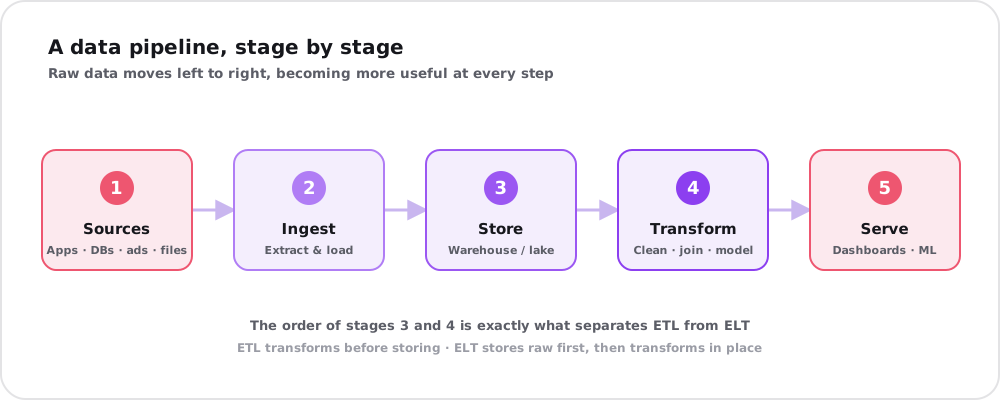
Data moves left to right, becoming more useful at each step. Everything downstream inherits the quality of what happened upstream.
The five stages, step by step
1. Sources. This is wherever your data is born: the transactional database behind your app, your CRM, ad platforms like Google and Meta, payment processors, IoT sensors, third-party APIs, and the humble spreadsheet. Sources are messy by nature — each has its own format, its own idea of what a “customer” is, and its own update rhythm.
2. Ingest. The pipeline connects to each source and pulls the data in — sometimes copying everything, more often capturing just what changed since last time (incremental loading, which is far cheaper at scale). This is the stage that tools like Fivetran, Airbyte, or a custom connector handle: the unglamorous but critical job of reliably getting data out of systems that were never designed to give it up gracefully.
3. Store. The data lands in a central repository built for analysis — a data warehouse (structured, query-optimized) or a data lake (raw, flexible, cheap). Which one, and why, is a decision in itself; we unpack it in data warehouse vs data lake vs lakehouse. What matters here is that the data now lives in one place instead of ten.
4. Transform. Raw data is rarely usable as-is. This stage cleans it (fixing nulls, deduplicating, standardizing dates and currencies), joins it (stitching the CRM’s customers to the payment system’s transactions), and models it into the tables your business actually thinks in — revenue by region, active users by month. This is where scattered raw records become a coherent version of the truth.
5. Serve. Finally the clean data is delivered to whatever consumes it: a business intelligence dashboard, a spreadsheet an analyst pivots, a machine-learning model, or another application. This is the only stage most of the business ever sees — which is exactly why the four invisible stages before it matter so much.
ETL vs ELT: the order that changed everything
Notice that two of those stages — store and transform — could happen in either order. That single choice has a name, and it defines two eras of data engineering.
ETL (Extract, Transform, Load) is the classic approach: pull the data, transform it into its final shape first, then load the finished result into the warehouse. It made sense when storage and compute were expensive and on-premise — you cleaned data down to only what you needed before paying to store it.
ELT (Extract, Load, Transform) flips the last two steps: pull the data, load it raw into the warehouse immediately, then transform it in place using the warehouse’s own power. This is now the default for cloud-native data platforms, for one simple reason — cloud storage became cheap and cloud warehouses (BigQuery, Snowflake, Redshift) became enormously powerful, so there is no longer a penalty for storing raw data and transforming it later.
| Dimension | ETL (transform first) | ELT (load raw first) |
|---|---|---|
| Order | Extract → Transform → Load | Extract → Load → Transform |
| Transform runs | In a separate engine, before loading | Inside the warehouse, after loading |
| Raw data kept? | No — only the cleaned result lands | Yes — raw is preserved, re-usable |
| Best fit | Legacy, on-prem, strict pre-load rules | Cloud warehouses, evolving questions |
| Flexibility | Lower — reshaping means re-extracting | Higher — re-transform stored raw data |
| Typical era | The on-premise past | The cloud-native default today |
The practical win of ELT is flexibility: because the raw data is still sitting in the warehouse, when someone asks a question you did not anticipate, you just write a new transformation — no need to go back and re-pull from the source. ETL still earns its place where data must be cleaned or masked before it is allowed to land, which is common in compliance-sensitive or legacy integrations.
Batch vs streaming: how fresh does it need to be?
The other big choice is when data flows. A batch pipeline runs on a schedule — every night, every hour — moving data in chunks. A streaming pipeline moves each record continuously, seconds after it is created.
| Batch | Streaming | |
|---|---|---|
| Data moves | On a schedule, in chunks | Continuously, record by record |
| Freshness | Minutes to hours old | Near real-time |
| Cost & effort | Lower, simpler to run | Higher, more moving parts |
| Good for | Reports, finance, most BI | Fraud alerts, live ops, tracking |
The honest default is batch. Real-time is genuinely required less often than people assume — a nightly refresh is perfectly fine for weekly revenue reports, and paying for streaming to power a dashboard nobody checks before 9am is waste. Reach for streaming when a decision depends on freshness: flagging fraud, throttling a live system, reacting to inventory as it moves. Match the pipeline’s speed to the decision it feeds, not to what sounds impressive.
Why pipelines break — and how trust is kept
A pipeline is only as valuable as the trust people place in its output, and that trust is easy to lose. A source silently changes a field name; a currency arrives in the wrong denomination; a duplicate load double-counts revenue; an upstream API goes down and yesterday’s numbers quietly stop updating. Because every stage inherits the one before it, a small error at ingestion becomes a wrong number on the CEO’s dashboard — and nobody notices until a decision has already been made on it.
Robust pipelines defend against this with a few disciplines: validation (checks that reject data failing basic rules — no negative ages, no future dates), monitoring and alerting (so a failed run pages a human instead of failing silently), idempotency (re-running a step produces the same result, not duplicates), and observability (knowing where each number came from). None of this is glamorous, and all of it is the difference between analytics people rely on and dashboards they have quietly learned to distrust.
The modern approach: composable, not monolithic
Today’s data pipelines are rarely one giant program. The dominant pattern is composable — three separable layers you can buy, build, or self-host independently: ingestion (getting data in), transformation (SQL-based tools like dbt that let analysts model data as version-controlled, tested code), and activation (pushing the results back out to dashboards, ad platforms, and apps).
The advantage is that you are not locked into one vendor’s take on all three. A lean team can wire managed connectors to a cloud warehouse and a transformation tool and have a production-grade pipeline running in days — the same shift from owning everything to renting capability that reshaped infrastructure choices more broadly. Start with the smallest pipeline that answers your real questions, and add sophistication — streaming, machine learning, finer-grained modeling — only when a concrete need pulls you there.
Conclusion
A data pipeline is simply the automated path your data takes from where it is created to where it earns its keep: source, ingest, store, transform, serve. The choices along that path — ELT’s store-then-transform flexibility, batch’s simplicity versus streaming’s freshness, the quiet discipline that keeps the numbers honest — are what separate a pipeline you can bet the business on from one that erodes trust every time it runs.
You do not need the most elaborate pipeline; you need the one that reliably answers the questions you actually ask. If your data is scattered across systems and you want a straight path from raw records to decisions you can trust, that is exactly the kind of problem we love to untangle — reach out for a free consultation.