
Data Quality: Why Bad Data Costs More Than No Data
Bad data quietly breaks every dashboard, forecast, and decision it touches. Here are the six dimensions of data quality, what poor data really costs, and how to build trust into your data.
- Data Analytics
- Data Quality
- Data Governance
- Data Engineering

Every dashboard you trust, every forecast you act on, and every “how did we do last quarter?” answer rests on a single quiet assumption: that the numbers underneath are true. Most of the effort in data analytics goes into moving data, storing it, and displaying it beautifully — and almost none goes into asking whether the data was right in the first place.
That gap is expensive. A pipeline can be fast, a warehouse can be tidy, and a dashboard can be gorgeous, and the whole thing can still lead you confidently in the wrong direction — because a decision made on bad data is worse than no decision at all. At least “we don’t know” keeps you cautious. A precise, well-designed chart built on broken data makes you certain, and certainty is what gets acted on. This article explains what data quality actually means, what poor quality really costs, where it comes from, and how to build trust into your data before it reaches the people making decisions.

Garbage in, garbage out: clean and contaminated data flow into the same reports, and the good cannot fully rescue the bad.
What “data quality” actually means
“Good data” sounds vague until you break it into the specific ways data can be wrong. Practitioners measure quality across six well-established dimensions. A dataset is only as trustworthy as its weakest one — a customer table can be 100% accurate and still useless if half the rows are missing an email address.
| Dimension | The question it answers | What “bad” looks like |
|---|---|---|
| Accuracy | Does the value match reality? | A customer’s address is real, but not theirs |
| Completeness | Is anything missing? | Orders with no region, so regional totals undercount |
| Consistency | Does it agree across systems? | The CRM says “won”, the finance system says “pending” |
| Timeliness | Is it current enough to act on? | Today’s decision runs on last week’s numbers |
| Validity | Does it fit the expected format and rules? | A phone number in the date field; a negative quantity |
| Uniqueness | Is each real-world thing represented once? | One customer counted three times, inflating the count |
The point of naming them is that “improve our data quality” becomes a set of concrete, checkable questions instead of a vague aspiration. Each dimension can be measured, monitored, and enforced.
The real cost of bad data
The damage from poor data quality is easy to underestimate because it rarely arrives as a single dramatic failure. It seeps in — a slightly wrong number here, a duplicated record there — until decisions, reports, and customer experiences are all quietly a little off.
The headline figures are sobering. Industry research puts the average cost of poor data quality at roughly $12.9 million per organization per year, and estimates that bad data can quietly consume 15–25% of revenue through wasted effort, missed opportunities, and bad decisions. Those are averages across the economy, not scare numbers — the mechanism behind them is mundane: people redo work, chase down discrepancies, and lose trust in the very reports meant to guide them.
There is a useful rule of thumb from the quality world — the 1‑10‑100 rule. It costs roughly $1 to prevent a data error at the point of entry, about $10 to correct it later once it is already in your systems, and around $100 in downstream damage if it is never caught and flows into decisions, reports, and customer interactions. The numbers are illustrative, but the shape is the lesson: fixing data quality early is an order of magnitude cheaper than fixing it late, and two orders cheaper than living with it.
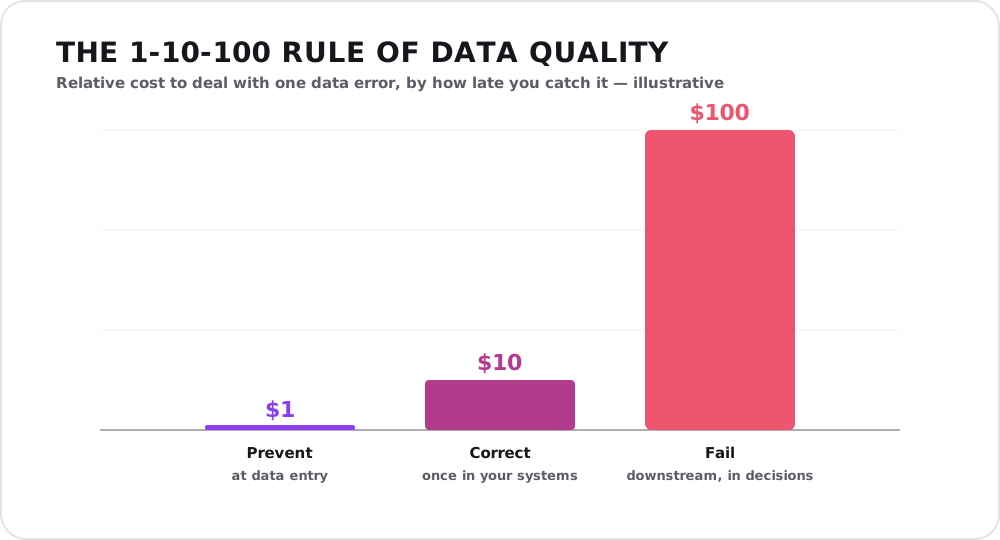
Illustrative figures — the exact numbers vary, but the shape holds: every step you delay catching a data error multiplies what it costs to deal with.
The most corrosive cost, though, isn’t on any invoice: lost trust. Once a team catches its dashboard being wrong a few times, people stop believing it. They go back to their own spreadsheets, the “single source of truth” fractures into a dozen private versions, and the entire investment in a proper data pipeline and a BI dashboard quietly stops paying off.
Where bad data comes from
Bad data is rarely the result of one careless mistake. It accumulates from predictable sources, and knowing them is the first step to stopping it:
- Manual entry. Humans typing into forms and spreadsheets produce typos, inconsistent formats, and blank fields — the single largest source of errors in most organizations.
- System integration. When data moves between a website, a CRM, a point-of-sale system, and an accounting tool, mismatched formats and definitions create silent conflicts. Is “revenue” gross or net? Each system may answer differently.
- Data decay. Data rots over time even if it was perfect when entered. People move, companies rename, products get discontinued — roughly a fifth of contact data goes stale every year.
- Schema and upstream changes. A source system adds a field, renames a column, or changes a unit, and a pipeline that assumed the old shape keeps running — producing wrong numbers rather than an obvious crash.
- No single owner. When everyone uses the data but no one is responsible for it, small problems have no one whose job it is to fix them, so they compound.
Building quality in, not bolting it on
The instinct with bad data is to clean it after the fact — a big one-off scrubbing project. That helps once, but the data starts degrading again the moment you finish. Durable data quality is a system, not a cleanup. It works the same way good software quality does: you build the checks into the flow so problems are caught where they are cheapest to fix.
- Profile before you trust. Before building anything on a dataset, examine it: how many nulls, what ranges, how many duplicates, what distributions? Profiling turns “I think the data is fine” into evidence.
- Validate at the door. The cheapest place to catch bad data is where it enters — the $1 in the 1‑10‑100 rule. Enforce formats, required fields, and sensible ranges at entry and at ingestion, so obviously wrong records are rejected or flagged before they spread.
- Test data like you test code. Add automated checks that run in the pipeline: this column is never null, this total reconciles with that one, row counts stay in a sane range. When a check fails, the pipeline alerts instead of silently publishing wrong numbers.
- Monitor continuously (data observability). Beyond fixed rules, watch the data’s behaviour over time — freshness, volume, and schema. If a table that normally gains a million rows a day suddenly gains none, you want to know before the CEO does. This practice, data observability, is a fast-growing discipline precisely because it catches the failures rules didn’t anticipate.
- Give data an owner. Assign clear ownership — a person or team accountable for each important dataset’s quality, with the authority to fix root causes. This is the human core of data governance: not bureaucracy, but knowing whose job it is when a number looks wrong.
Data quality vs data observability
These two terms get used interchangeably, but the distinction is useful. Data quality is about the data itself being correct against known rules — is this value accurate, complete, valid? Data observability is about the health of the system that delivers the data — is it fresh, did the expected volume arrive, did the schema change? Rules catch the problems you predicted; observability surfaces the ones you didn’t. A mature setup uses both: explicit quality checks for the known risks, and observability as the smoke detector for everything else.
Where to start
You don’t need a governance department to make real progress. Start where the risk is highest and the effort is lowest:
- Pick your critical data. Find the handful of datasets that drive real decisions — revenue, customers, key operational metrics — and focus there first. Not all data deserves equal effort.
- Measure before you fix. Profile those datasets against the six dimensions so you know your actual baseline, rather than guessing. You cannot improve what you have not measured.
- Add checks at the highest-leverage point. Usually that is validation at entry and a few automated tests on the most important tables — small effort, large payoff.
- Name owners. Assign accountability for each critical dataset before you scale the tooling. Tools enforce rules; people fix root causes.
- Then automate and expand. Once the basics hold, layer in observability and widen coverage. Quality compounds — early discipline makes every later step cheaper.
Conclusion
Data quality is the least glamorous part of analytics and the one that decides whether any of the rest is worth having. The fastest pipeline and the most elegant dashboard are only as trustworthy as the numbers flowing through them — and when those numbers are wrong, a confident chart does more harm than an honest “we don’t know.” The organizations that win with data are not the ones with the most of it; they are the ones that can trust what they have, because they built that trust in deliberately, checked it continuously, and gave someone the job of keeping it.
If your dashboards and reports don’t quite line up — or you are about to build on data you are not sure you can trust — that is exactly the kind of problem we like to untangle. Reach out for a free consultation.