
Predictive Analytics: How to Use Data to See What Happens Next
A practical guide to predictive analytics for business — what it is, how it works, where it pays off (demand, churn, fraud, maintenance), and how to start without overreaching.
- Data Analytics
- Predictive Analytics
- Forecasting
- Machine Learning

Most business reporting is a rear-view mirror. Dashboards, monthly reports, and BI tools tell you what already happened — last quarter’s revenue, last week’s churn, yesterday’s stockouts. That history is essential, but it arrives too late to change the outcome. By the time a report shows a customer left, the customer is gone.
Predictive analytics turns the mirror into a windshield. Instead of only describing the past, it uses that past to estimate what is likely to happen next — which customers are about to cancel, how much stock next month will need, which transaction looks like fraud — while there is still time to act. This guide explains what predictive analytics really is, how it works in plain terms, where it earns its keep, and how to start without overreaching or fooling yourself.

Descriptive reporting is the rear-view mirror; predictive analytics is the road ahead through the windshield.
From “what happened” to “what’s next”
Analytics matures in stages, and predictive sits near the top. Each stage answers a harder question and delivers more leverage than the last:
| Stage | Question it answers | Example |
|---|---|---|
| Descriptive | What happened? | Sales fell 12% last month. |
| Diagnostic | Why did it happen? | Sales fell because a key region churned. |
| Predictive | What is likely to happen? | These 400 accounts will probably churn next. |
| Prescriptive | What should we do about it? | Offer this segment a targeted retention plan. |
Most organizations live comfortably in the first two stages and treat the third as exotic or “AI magic.” It is not. Predictive analytics is mostly disciplined pattern recognition: give a model enough examples of what happened before, and it learns the signals that tend to precede an outcome, then applies those signals to today’s data to score what is coming.
How it actually works
Strip away the jargon and the mechanics are intuitive. A predictive model learns from history and applies what it learned to the present.
- Frame the question. Not “tell me about churn,” but “which customers are likely to cancel in the next 60 days?” A sharp, time-bound question is half the work.
- Assemble the history. Pull the relevant past — customer behavior, transactions, support tickets, seasonality — usually the last 12–24 months, with the outcome already known for each record (this customer did cancel; that one didn’t).
- Train the model. An algorithm studies those historical examples and learns the patterns that separated the two outcomes: falling logins, rising complaints, a lapsed payment.
- Score the present. The trained model looks at today’s live customers and assigns each a probability — a risk score, a forecast number, a fraud flag.
- Act, then learn. The team acts on the scores, watches what really happens, and feeds those results back so the model sharpens over time.
The output is almost never a single certain answer. It is a probability with a range — “roughly 1,200 units next month, likely between 1,050 and 1,350.” Treating that range as a guarantee is the fastest way to be surprised; treating it as a well-informed bet is the point.
A forecast in practice
The most common predictive job is a forecast: project a trend forward and put honest bounds around it. Historical demand feeds a model that extends the line into the future — not as a single crisp number, but as an expected path inside a band of uncertainty that the team plans against.
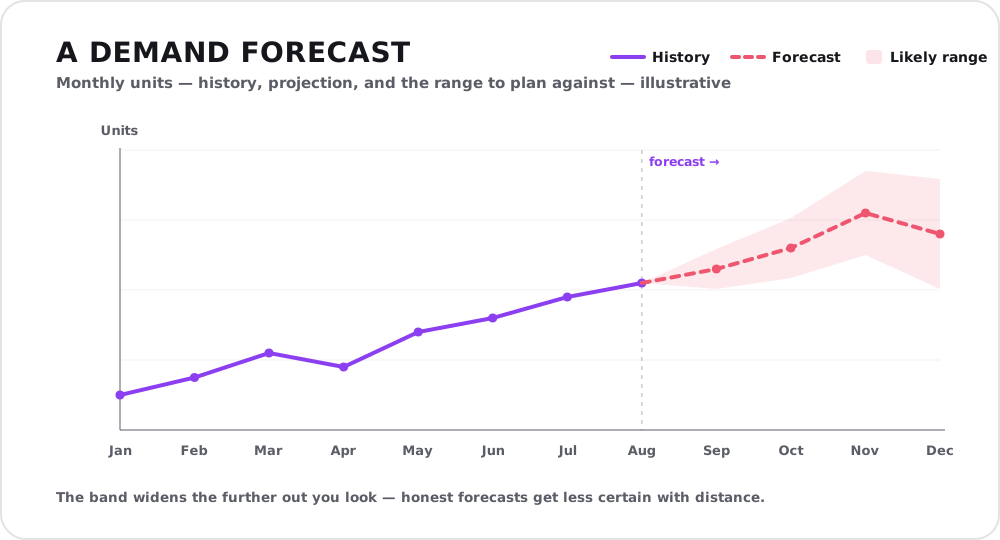
The center line is the best single guess; the shaded band is the range reality is likely to fall in — and it widens with distance, because honest forecasts get less certain the further ahead they reach.
Read a forecast the way an experienced operator does: the center line is the best single guess, and the band is where reality will probably land. Plan inventory, staffing, and cash flow against the band, not the optimistic edge.
Where predictive analytics pays off
Predictive analytics is not one tool; it is a way of thinking applied to whatever outcome costs you money when it surprises you. The workhorses:
- Demand forecasting. Predict how much of each product will sell, by location and period, so you hold the right stock — avoiding both dead inventory and stockouts. Retailers fold in weather, promotions, and local events to sharpen the estimate.
- Churn prediction. Score which customers are drifting toward cancellation before they leave, so retention effort lands on the accounts that are both at risk and worth saving — not on everyone or, worse, on no one.
- Fraud and risk detection. Flag transactions or applications that resemble past fraud or default, in time to hold or review them rather than write off the loss.
- Predictive maintenance. Watch equipment sensor data to predict failures before they happen, so you service a machine on a planned Tuesday instead of during an emergency that halts production.
- Lead scoring. Rank sales leads by likelihood to convert, so a limited sales team spends its hours where deals are most probable.
The common thread: each turns a costly surprise into an early, actionable signal. The value is not the prediction itself — it is the decision the prediction lets you make sooner.
What you need before you start
Predictive analytics runs on data, and it inherits every flaw in that data. Three foundations decide whether a project produces insight or confident nonsense.
- Enough clean history. Models learn from examples. Too few, or poor-quality data, and the model learns noise. “Garbage in, garbage out” is not a slogan here; it is the whole ballgame.
- A reliable way to get the data. Predictions need current inputs on a schedule, which means a dependable data pipeline feeding the model — not a spreadsheet someone updates by hand when they remember.
- A decision the prediction will change. A score nobody acts on is a vanity metric. Before building anything, name the action a good prediction will trigger and who owns it. No decision, no project.
You do not need a data-science department or a big-bang platform to begin. A single, well-chosen question — one costly outcome you keep getting surprised by — is enough to prove value. That is exactly the kind of scoping our data analytics team does before a line of model code is written.
Where it goes wrong
Predictive projects fail in predictable ways. Knowing the traps is half of avoiding them.
- Confusing correlation with causation. A model can learn that ice-cream sales predict drownings; acting on that by banning ice cream would be absurd. Models find patterns, not reasons — human judgment supplies the “why.”
- Overfitting. A model tuned to explain the past perfectly often predicts the future terribly, because it memorized noise instead of learning the signal. A model is only as good as its performance on data it has never seen.
- Set-and-forget. The world drifts. A model trained before a market shift, a new competitor, or a pandemic quietly decays. Predictions need monitoring and periodic retraining, not a launch and a farewell.
- Chasing precision over usefulness. A prediction that is 70% accurate and acted on beats one that is 95% accurate and ignored. Ship the useful version, then improve it.
Start small, aim honest
The organizations that win with predictive analytics rarely start with a moonshot. They pick one costly, repeated surprise — a specific product’s demand, a specific segment’s churn — build the smallest model that beats guessing, wire it into a real decision, and measure whether the decision improved. Then they do it again.
Predictive analytics does not hand you a crystal ball, and anyone who promises certainty is selling something. What it gives you is a disciplined, data-grounded head start — enough warning to act while acting still matters. In a market where the competition is still reading last month’s report, seeing a little further ahead is a real advantage.
If you have a costly surprise you would like to see coming — a demand spike, a churn wave, a fraud pattern — that is exactly the kind of problem we like to scope honestly before anyone builds a model. Reach out for a free consultation.